Version v3.2 of This version of etcd is no longer supported. For the latest version, please see the latest stable version. For the latest stable documentation, see v3.7.
Monitoring etcd
Each etcd server provides local monitoring information on its client port through http endpoints. The monitoring data is useful for both system health checking and cluster debugging.
Debug endpoint
If --debug is set, the etcd server exports debugging information on its client port under the /debug path. Take care when setting --debug, since there will be degraded performance and verbose logging.
The /debug/pprof endpoint is the standard go runtime profiling endpoint. This can be used to profile CPU, heap, mutex, and goroutine utilization. For example, here go tool pprof gets the top 10 functions where etcd spends its time:
$ go tool pprof http://localhost:2379/debug/pprof/profile
Fetching profile from http://localhost:2379/debug/pprof/profile
Please wait... (30s)
Saved profile in /home/etcd/pprof/pprof.etcd.localhost:2379.samples.cpu.001.pb.gz
Entering interactive mode (type "help" for commands)
(pprof) top10
310ms of 480ms total (64.58%)
Showing top 10 nodes out of 157 (cum >= 10ms)
    flat  flat%   sum%        cum   cum%
   130ms 27.08% 27.08%      130ms 27.08%  runtime.futex
    70ms 14.58% 41.67%       70ms 14.58%  syscall.Syscall
    20ms  4.17% 45.83%       20ms  4.17%  github.com/coreos/etcd/cmd/vendor/golang.org/x/net/http2/hpack.huffmanDecode
    20ms  4.17% 50.00%       30ms  6.25%  runtime.pcvalue
    20ms  4.17% 54.17%       50ms 10.42%  runtime.schedule
    10ms  2.08% 56.25%       10ms  2.08%  github.com/coreos/etcd/cmd/vendor/github.com/coreos/etcd/etcdserver.(*EtcdServer).AuthInfoFromCtx
    10ms  2.08% 58.33%       10ms  2.08%  github.com/coreos/etcd/cmd/vendor/github.com/coreos/etcd/etcdserver.(*EtcdServer).Lead
    10ms  2.08% 60.42%       10ms  2.08%  github.com/coreos/etcd/cmd/vendor/github.com/coreos/etcd/pkg/wait.(*timeList).Trigger
    10ms  2.08% 62.50%       10ms  2.08%  github.com/coreos/etcd/cmd/vendor/github.com/prometheus/client_golang/prometheus.(*MetricVec).hashLabelValues
    10ms  2.08% 64.58%       10ms  2.08%  github.com/coreos/etcd/cmd/vendor/golang.org/x/net/http2.(*Framer).WriteHeaders
The /debug/requests endpoint gives gRPC traces and performance statistics through a web browser. For example, here is a Range request for the key abc:
When	Elapsed (s)
2017/08/18 17:34:51.999317 	0.000244 	/etcdserverpb.KV/Range
17:34:51.999382 	 .    65 	... RPC: from 127.0.0.1:47204 deadline:4.999377747s
17:34:51.999395 	 .    13 	... recv: key:"abc"
17:34:51.999499 	 .   104 	... OK
17:34:51.999535 	 .    36 	... sent: header:<cluster_id:14841639068965178418 member_id:10276657743932975437 revision:15 raft_term:17 > kvs:<key:"abc" create_revision:6 mod_revision:14 version:9 value:"asda" > count:1
The metrics can be fetched with curl:
$ curl -L http://localhost:2379/metrics

# HELP etcd_debugging_mvcc_keys_total Total number of keys.
# TYPE etcd_debugging_mvcc_keys_total gauge
etcd_debugging_mvcc_keys_total 0
# HELP etcd_debugging_mvcc_pending_events_total Total number of pending events to be sent.
# TYPE etcd_debugging_mvcc_pending_events_total gauge
etcd_debugging_mvcc_pending_events_total 0
...
Prometheus
Running a Prometheus monitoring service is the easiest way to ingest and record etcd’s metrics.
First, install Prometheus:
PROMETHEUS_VERSION="1.3.1"
wget https://github.com/prometheus/prometheus/releases/download/v$PROMETHEUS_VERSION/prometheus-$PROMETHEUS_VERSION.linux-amd64.tar.gz -O /tmp/prometheus-$PROMETHEUS_VERSION.linux-amd64.tar.gz
tar -xvzf /tmp/prometheus-$PROMETHEUS_VERSION.linux-amd64.tar.gz --directory /tmp/ --strip-components=1
/tmp/prometheus -version
Set Prometheus’s scraper to target the etcd cluster endpoints:
cat > /tmp/test-etcd.yaml <<EOF
global:
  scrape_interval: 10s
scrape_configs:
  - job_name: test-etcd
    static_configs:
    - targets: ['10.240.0.32:2379','10.240.0.33:2379','10.240.0.34:2379']
EOF
cat /tmp/test-etcd.yaml
Set up the Prometheus handler:
nohup /tmp/prometheus \
    -config.file /tmp/test-etcd.yaml \
    -web.listen-address ":9090" \
    -storage.local.path "test-etcd.data" >> /tmp/test-etcd.log  2>&1 &
Now Prometheus will scrape etcd metrics every 10 seconds.
Alerting
There is a set of default alerts for etcd v3 clusters.
job labels may need to be adjusted to fit a particular need. The rules were written to apply to a single cluster so it is recommended to choose labels unique to a cluster.
Grafana
Grafana has built-in Prometheus support; just add a Prometheus data source:
Name:   test-etcd
Type:   Prometheus
Url:    http://localhost:9090
Access: proxy
Then import the default etcd dashboard template and customize. For instance, if Prometheus data source name is my-etcd, the datasource field values in JSON also need to be my-etcd.
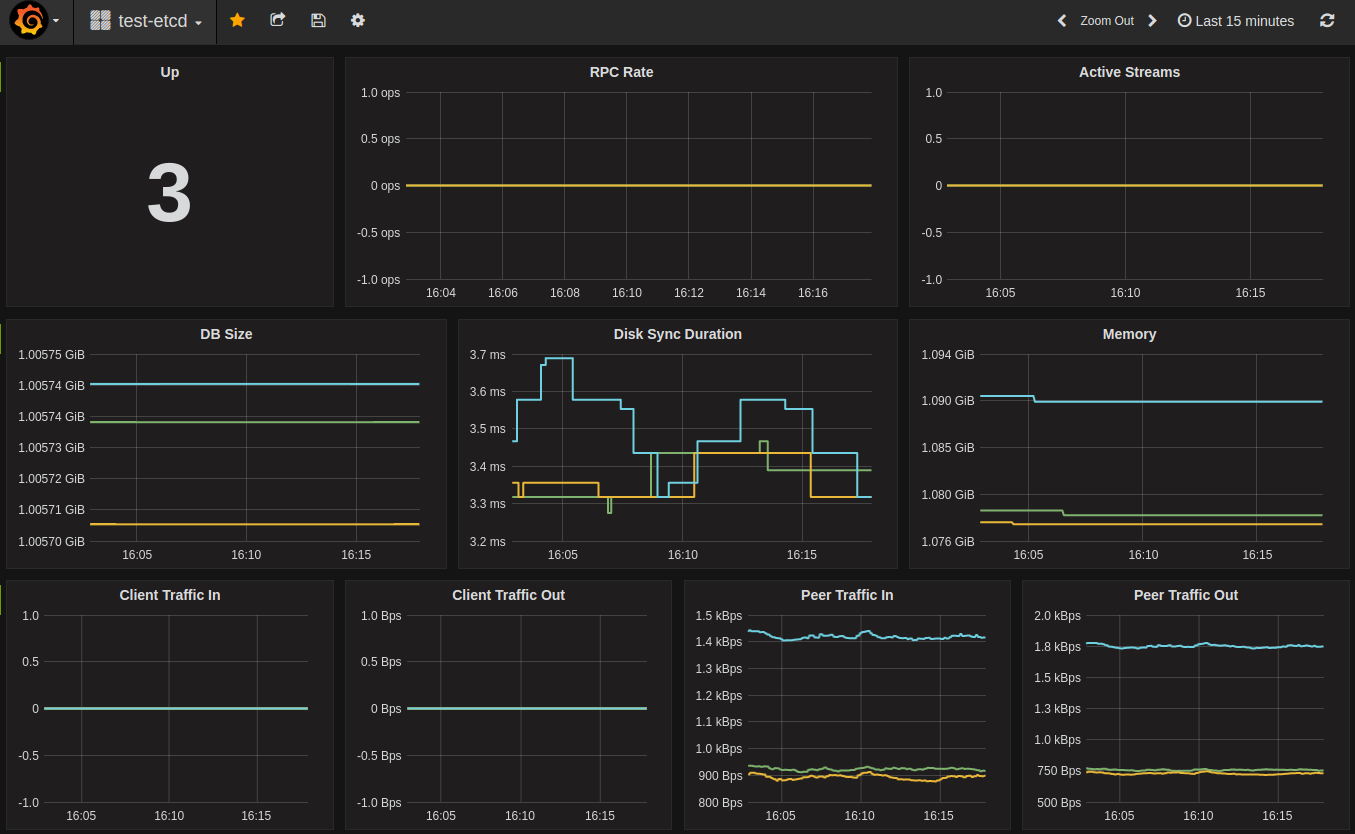
Sample dashboard:
Feedback
Was this page helpful?
Glad to hear it! Please tell us how we can improve.
Sorry to hear that. Please tell us how we can improve.